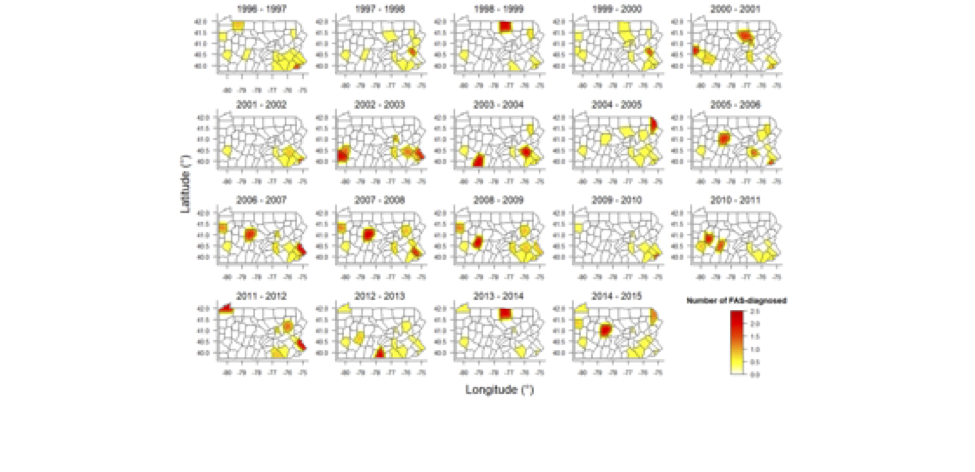


I spatially and temporally analyze the annual live-birth data given in the Pennsylvania hospital reports of 235 hospitals in 67 Pennsylvania counties, from July 1, 1996 to June 30, 2015. The low cross-correlations, from the smallest −0.255 to the largest +0.047, between the two variables—the drug-exposed newborns and the FAS-diagnosed newborns are computed, and their weak relationship is shown on smoothed heat maps. Also, I classify the 67 counties into three different groups in terms of the prevalence of (1) drug-exposed, (2) FAS-diagnosed, and (3) none, using statistical discriminant methods—linear discriminant analysis, quadratic discriminant analysis, and regularized discriminant analysis.
This talk will be accessible to Juniors and Seniors.